July 6, 2026

Managing Partner

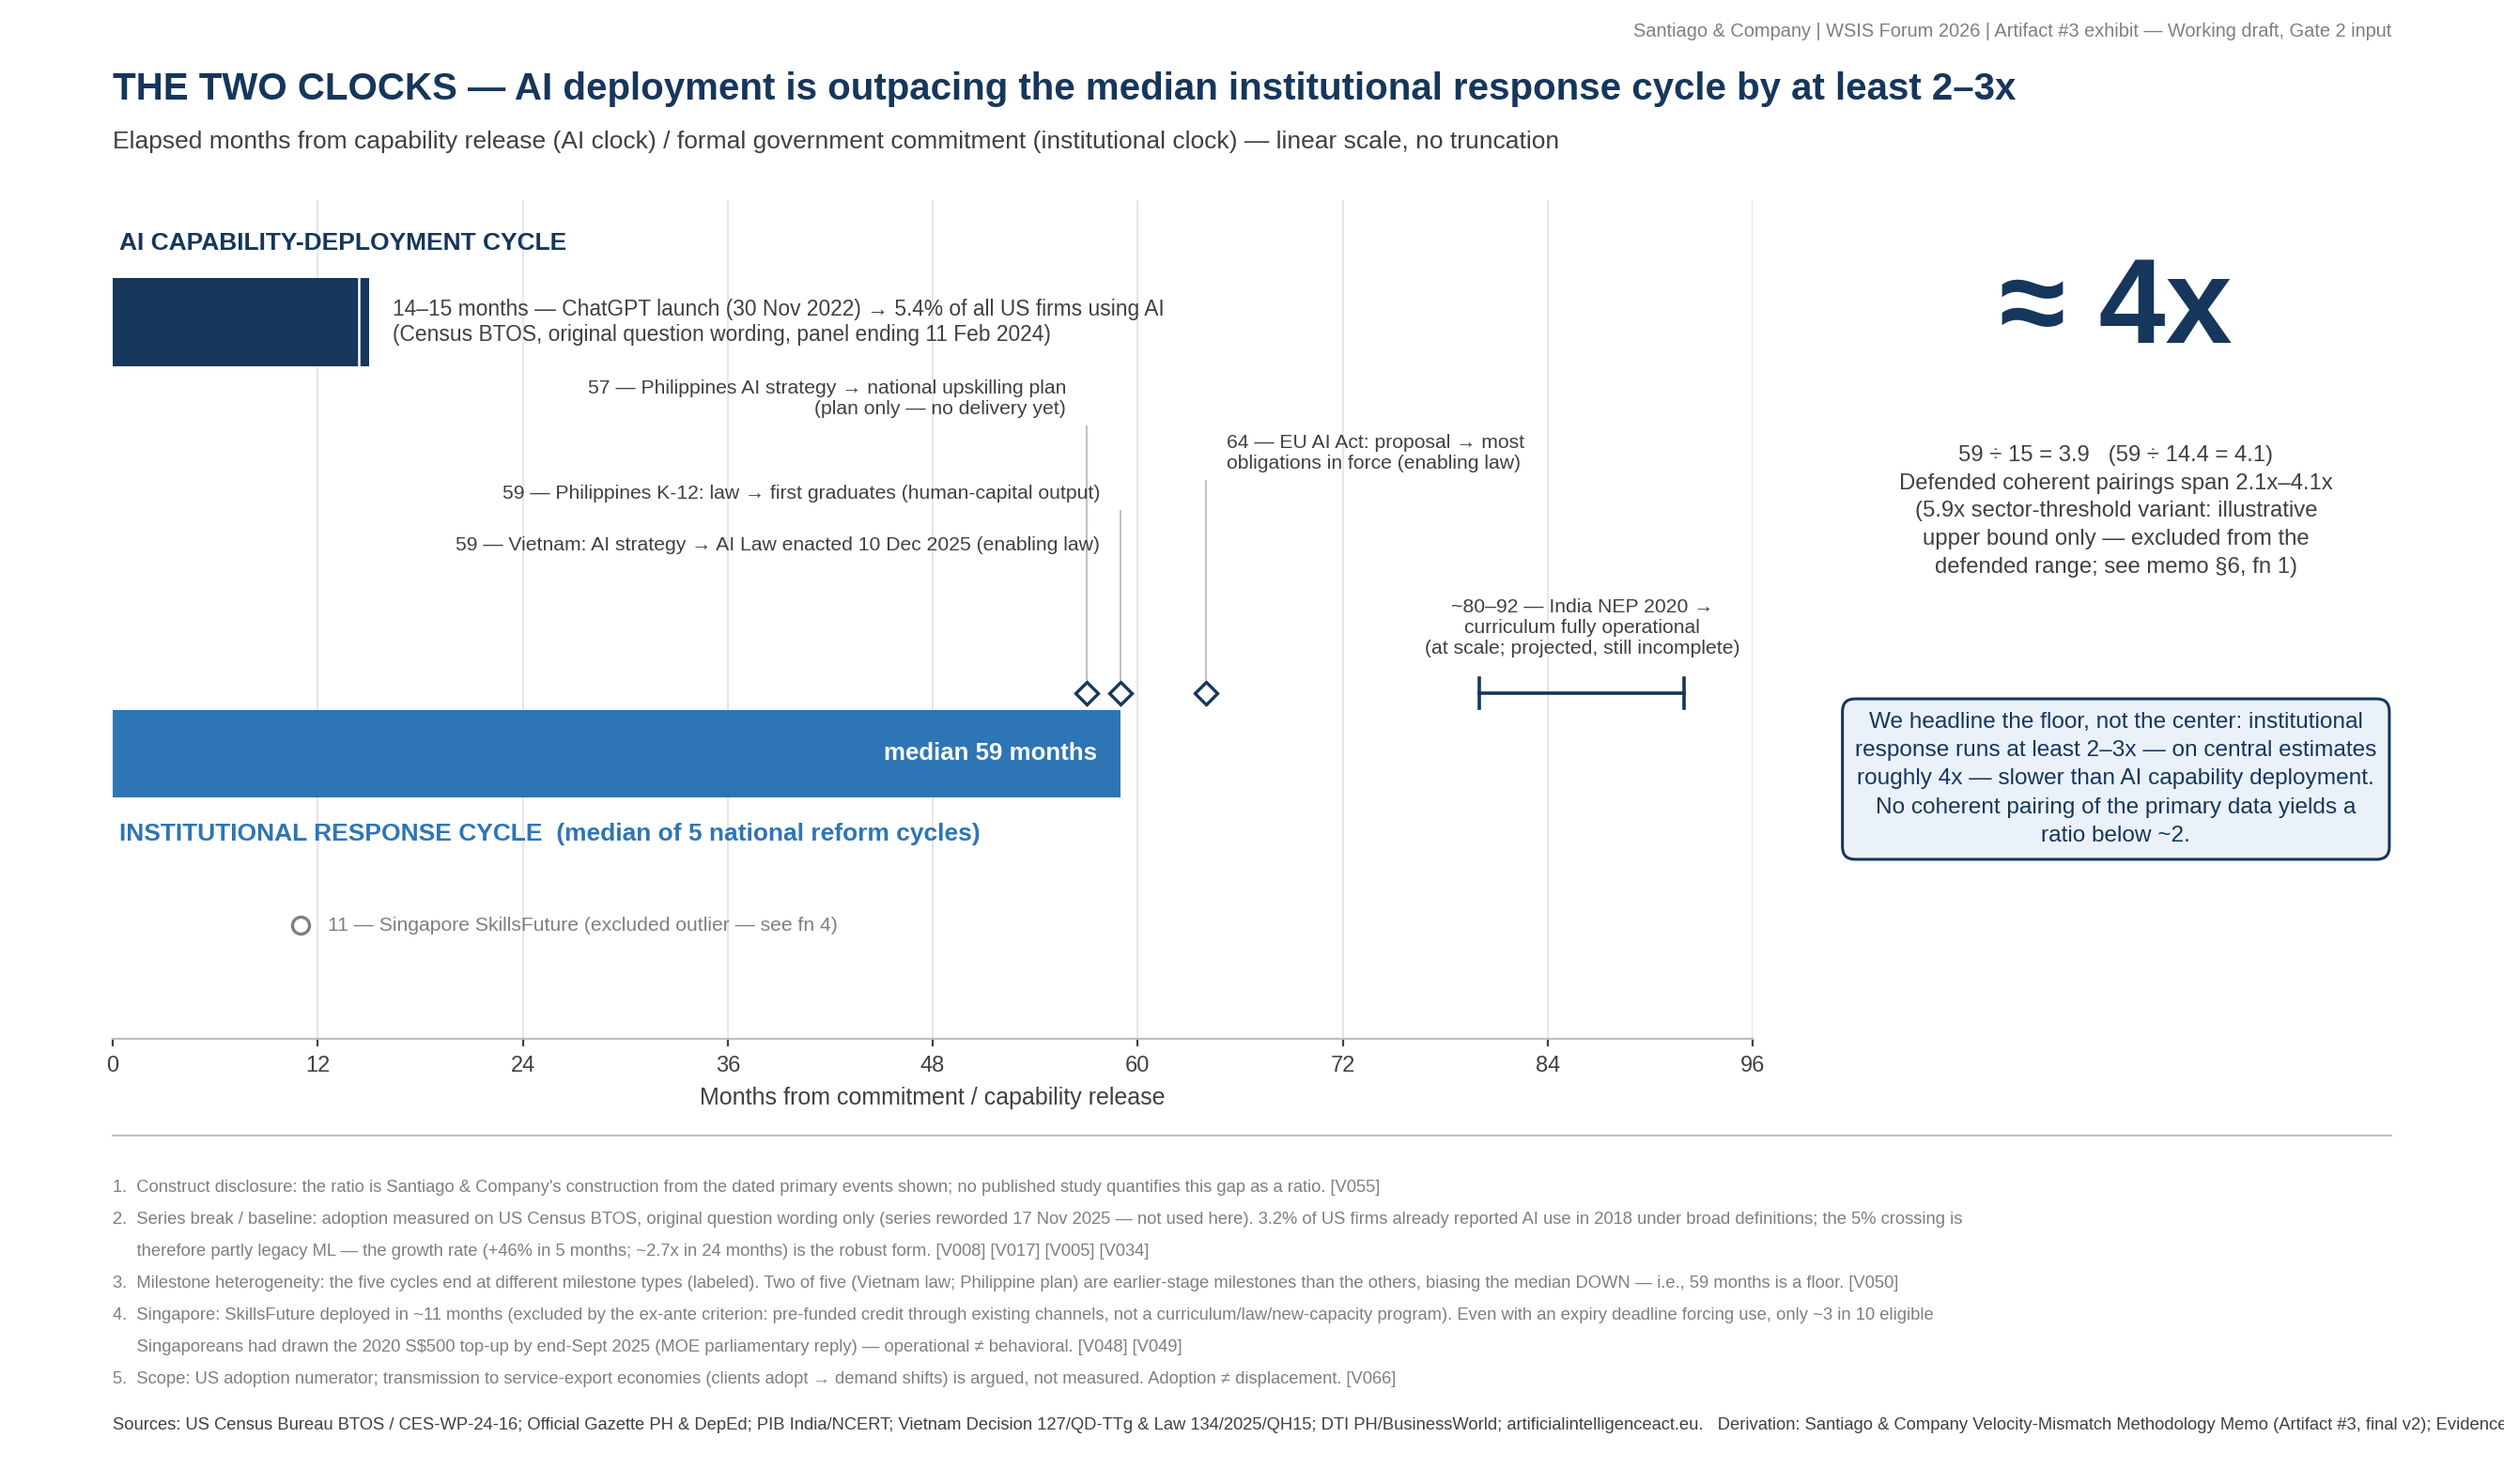
AI capability reached measurable economy-wide business adoption in about 14 to 15 months. The median national workforce reform takes 59 months to deliver its first operational milestone. For service-export economies, that ratio is the planning problem, not any forecast of job losses.
The first measures how quickly a new AI capability becomes a standard business practice. From the launch of ChatGPT in November 2022, it took roughly 14 to 15 months for more than 5% of all US employer businesses, not just technology firms, to report using AI in producing their goods and services, according to the US Census Bureau’s survey of the business population. The second clock measures how quickly a government can change what its workforce can do. Across the workforce, education, and AI governance reforms most relevant to service-export economies, the median time from decision to the first operational milestone is 59 months. Divide the slow clock by the fast one, and you have the subject of this article: the institutional response now runs at least 2 to 3 times slower than the deployment cycle it is meant to answer, and, on our central estimate, closer to 4 times.
This is not a forecast of unemployment, and it does not rest on one. It is a statement about pacing, and pacing is the one variable a government can neither predict away nor legislate away. For an economy whose budget relies on exported services, the timing gap determines whether the AI transition is managed in advance or improvised after the receipts have already turned. The argument here is that the gap cannot be closed, and that the right response is therefore not to forecast the shock or to legislate faster but to pre-commit the fiscal response to observable triggers before the shock arrives. It is the one approach with a track record, and the one thing no current framework for AI and labor actually does.
Every discretionary choice in building the ratio was made in the direction that makes it smaller. The note below states plainly what the number is and is not. What follows is the derivation, followed by the case for what a government does when it cannot close a gap.
What the ratio is, and is not.
Most claims about AI adoption speed rest on app-download counts or vendor surveys, which is why most of them deserve suspicion. We anchored the numerator to the most conservative credible series available: the US Census Bureau’s Business Trends and Outlook Survey, which is firm-weighted and population-representative. It counts a five-person accounting practice the same way it counts a hyperscaler, and it asks whether a business is actually using AI to produce its goods and services, not whether it has experimented. On that series, AI use crossed 5.4 percent of all US employer businesses about 14 to 15 months after ChatGPT’s launch. The survey reworded its question in November 2025, producing a step in the series (measured use jumped from roughly 10 to 17 percent), so we date the crossing on the consistent pre-break series and disclose the break wherever the number appears.
Fourteen to 15 months to five percent of every employer business in the largest economy on earth is, by the standard of past general-purpose technologies, fast. The more important property of that number, for a service-export economy, is whose businesses they are. Those US firms are the clients. When adoption moves inside the sectors that buy contact-center seats, code maintenance, and back-office processing, the demand side of a $40 billion Philippine industry or a $315 billion Indian one has already begun to change, whether or not anything has yet changed in Manila or Bengaluru. The fast clock is not ticking in some distant laboratory. It is ticking in the customer base.
The 59-month denominator is not a stylized complaint about government. It is drawn from the service-export economies themselves, on reforms of exactly the kind an AI transition demands. The Philippines’ K-12 education reform took 59 months from enactment to its first operational milestone. India’s National Education Policy of 2020 has now passed 70 months and remains incomplete in its sixth year. Vietnam ran 59 months from Decision 127, its national AI strategy, to the AI law passed in December 2025, with operational workforce programs still to follow. The European Union’s AI Act, the best-resourced digital-regulation process in the world, ran 64 to 76 months depending on which milestone you count. The median across that reference class is 59 months: not quite five years from decision to the first thing a working person would actually notice.
Singapore is the fast outlier, and worth confronting rather than burying. SkillsFuture moved from announcement to operational milestone in about 11 months, which shows the slow clock is a median, not a law of nature. But Singapore also shows why the speed of launch is not the binding constraint. Of those eligible for the S$500 credit top-up issued in 2020, only about 3 in 10 had drawn on it by the end of September 2025, despite its expiry at the end of that year. Standing up a program quickly and changing what a workforce can do are different achievements, and the 59-month median describes the latter.
Put the two clocks together honestly, pairing each adoption measure only with an institutionally comparable reform timeline, and the defensible mismatch runs from about 2.1 to 4.1 times, with a central estimate near four. No coherent pairing of the primary data produces a ratio below roughly two. The conservative version, and the one we will defend, is that institutions run at least two to three times slower than the technology and probably closer to four. The closest published treatment of the same mechanism, Levy Yeyati’s “Too Fast to Adjust” (2026), reaches the qualitative conclusion but publishes no ratio; ours remains a transparent construction, not a citation.

Velocity mismatches have happened before. What makes this one dangerous is that it arrives without a focal trigger. A pandemic, a typhoon, a bank run: each compresses political time and releases responses that were pre-agreed for exactly that moment. AI-driven displacement in service exports arrives instead as a quiet decoupling in the accounts, with revenue still rising while the intake of new workers thins from the bottom.
The precise account matters more than the dramatic one. In aggregate, employment in these sectors is still growing: the Philippines added roughly 80,000 IT-BPM jobs in 2025, and India added about 135,000 net technology jobs in its 2026 fiscal year. Anyone announcing collapse is ahead of the data. The signal sits one level down, at the entry rung. India’s gross intake of fresh graduates into IT services fell to 60,000–70,000 in FY24, a two-decade low, before recovering only partly to around 120,000 in FY25. The raw comparison invites a misreading, so we resist it: the FY22 peak of some 600,000 was an atypical post-pandemic surge, and the honest benchmark is the pre-pandemic norm of roughly 200,000 a year. Even against that norm, intake has fallen hard and stayed down. Industry revenue, meanwhile, grew about 6% in FY26, while headcount grew roughly 2%, and the industry’s own association now treats the decoupling as structural rather than cyclical. Tata Consultancy Services, India’s largest IT employer, ended its 2026 fiscal year with about 23,000 fewer staff than it began it. Management attributed the reduction to a skills mismatch rather than to AI, and we take that at face value. The point is not why any single firm cut, but that revenue and headcount have visibly come apart.
The entry rung is the only place this story is currently legible; by the time the aggregate numbers confirm it, the clock will already have been running against the response. Here is the arithmetic of that waiting. Suppose a government holds off on its response until the labor-market deterioration is undeniable, until the aggregate numbers, not merely the entry-level ones, have turned. It starts a 59-month institutional clock at that moment. The capability that caused the deterioration will by then have been compounding inside client industries for years, and the next capability wave will be some 14 to 15 months from its own measurable adoption. On central estimates, the response lands roughly 4 reform years after the problem it was meant to address. Not because anyone was negligent, but because the sequencing logic was built for shocks that announce themselves, and this one does not.
The two instinctive responses to a pacing mismatch are to forecast better and to legislate faster. Both fail here, and the reasons are specific.
Forecasting fails because the quantities to be forecast are not stable enough to build a budget on. The two official exposure estimates that ought to anchor any projection, the International Labour Organization’s and the International Monetary Fund’s, do not agree even on the order of magnitude: the ILO places roughly a quarter of global employment in the exposed zone, the IMF closer to 40 percent, because the two are measuring different constructs under the same word. A fiscal trigger wired to a base that unstable would fire early, late, or not at all. Legislating faster fails for the reason the second clock already established: even a well-resourced, well-intentioned reform takes the better part of five years to reach a worker, and no statute repeals that.
There is a third option, and unlike the first two it has an empirical record. Stop trying to predict the shock and pre-commit to a response to an agreed-upon observable trigger. Adjacent fields have already run the experiment. Kenya’s Hunger Safety Net Programme pays drought-affected households within about two weeks of a scale-up decision, because the payment rails and the trigger index were built before any given drought; it has scaled up two dozen times without collapsing. Chile’s structural balance rule banked on the order of 12 percent of GDP through the copper boom, precisely because the rule was agreed before the boom, and spent it as stimulus in 2009 when the trigger condition arrived. Colombia’s catastrophe deferred-drawdown line released $150 million within 48 hours of a flood, compared with the weeks or months it takes for an ad-hoc appeal. Basel III’s countercyclical capital buffer supplied the governing doctrine that makes all of this politically survivable: a low-noise indicator informs, and a named authority decides.
None of these instruments forecasts anything, and that is the point. Each built its rails, its trigger, and its named decider in peacetime, so the fast response was ready when it was needed. The limits of the analogy travel with it. Drought has a validated satellite index; a copper price has a reference path; a flood declares itself. AI labor displacement has no comparable validated trigger yet, and that missing piece is what a pilot has to build rather than assume. Because a labor-market trigger must clear a higher evidentiary bar than a flood warning, it will deliberately trade some of that 48-hour speed for rigor. So the claim is bounded, and we think defensible: pre-commitment to a well-designed trigger has repeatedly beaten improvisation on both speed and welfare, in domains structurally similar to this one. It is a stronger foundation than a forecast, not a guarantee.
If pre-commitment is the answer, the obvious question is: why hasn't anyone already applied it to AI and labour? We looked. Reviewing the seven frameworks that would be the natural home for such an instrument, the ILO’s just-transition guidance, the Global Digital Compact, the WSIS+20 outcome, the EU AI Act’s labour provisions, the ASEAN generative-AI guide, the ILO’s generative-AI work, and the OECD’s series of AI papers, we found no instance of trigger logic tied to export receipts, foreign-exchange, or tax-base variables: none in the six we read in full, and none in the titles or threat-relevant abstracts of the OECD’s 59-paper series. The mandates exist: the Global Digital Compact explicitly calls for national assessments of AI’s effects on labour and employment, and the WSIS+20 outcome commits its signatories to ensure these technologies “complement and augment human labour.” What is missing is the mechanism that turns an assessment into a pre-agreed response.
That absence is current, not historical. The International Labour Conference met through the first half of June 2026, around a Director-General’s report pointedly titled “A Moment of Choice,” and closed with no AI committee, no conclusions, and no resolution or action framework on AI; the single paragraph that names entry-level outsourcing risk attaches no metric to it. The distance between naming the problem and building the instrument is, as of this writing, still open.
It is the gap our own work is built to fill. The AI Workforce Stability Architecture — AWSA — is a design-stage instrument, now seeking country pilots in the Philippines, India, and Vietnam. It is easier to specify than to summarise, because it is built in four layers:
AWSA layer, What it does, Signal Tracks services-export receipts, sector payroll, consumption-tax takes, entry-level hiring, and regional concentration.
Trigger
Defines the threshold breaches and confidence rules that move the instrument from watching to acting.
Financing
Pre-commits bridge funding before labour-market deterioration becomes visible in the aggregate data.
Execution
Names the authority to act, the payment rails to use, and the workforce-response package to deploy.
We are deliberate about what this is and is not. Each layer is published with a claim-tier register that marks its elements as measured, constructed, or still to be validated in a pilot and the trigger index itself sits squarely in that third tier.
Evidence tiers
— Measured: AI-adoption timing (US Census BTOS); sector fiscal scale (IMF, NASSCOM, IBPAP); entry-level intake (Xpheno); the pre-commitment instruments’ records.
— Constructed: the ~4× pacing ratio and its reference class.
— Assumed, pending pilot: the demand-side transmission channel and AWSA’s trigger index.
AWSA is not offered as a validated result. It is offered as the instrument-shaped hole in an otherwise crowded policy landscape, and an argument for who should build it first.
Rigour means naming the conditions under which we would revise this, and four would move us. If the demand-side transmission we posit, Western AI adoption pulling work away from service-export providers, fails to appear in these economies’ balance-of-payments services lines over the coming quarters, the urgency case weakens even where the pacing gap holds. If a validated fast reference class emerges, AI-specific workforce reforms that reach workers well inside the 59-month median the ratio compresses toward the low end of its range and the case for pre-commitment softens. If entry-level hiring in India recovers durably to its pre-pandemic norm and stays there, the leading indicator we rely on will be a false alarm. And if a pre-committed labour trigger, once piloted, cannot be specified with an acceptable false-alarm rate, AWSA’s central premise fails on its own terms. We would rather state these tests now than defend the thesis past its evidence.
For a finance or labour minister in a service-export economy, the four-year gap reduces to a single planning question: which of our responses take 59 months, and on what date does their clock start? If the honest answer is “when the displacement is undeniable,” the response is late by construction, and no amount of forecasting sophistication changes that. The alternative is mechanical rather than heroic. Name the fiscal variables that would move first, the balance-of-payments line for services receipts, sector payroll and consumption-tax takes, and, where the exposure is sub-sovereign, the state-level concentrations that a national aggregate hides. Set scenario-based trigger levels in this budget cycle. Pre-finance a bridge on existing payment rails. Commission the long-cycle skills build at the first trigger breach rather than the first alarming headline. The 59-month clock starts in peacetime, and the fast rails carry the years in between.
The exposure is not evenly distributed, which is why the instrument has to be national rather than borrowed. In the Philippines, the sector is macro-critical in the IMF’s own language about 7.4 percent of GDP in 2023, on a scale with remittances, yet the fiscal channel runs not through corporate income tax, which largely waives incentives, but through consumption, payroll, and the current account. In India the concentration is regional: a single state accounts for roughly a tenth of national direct tax, and four states for the overwhelming majority of software exports, so a shock that looks mild in the union budget can be acute in a state one. Vietnam’s software and digital services exports are smaller today, which is exactly why its exposure is to the future growth model it is still climbing toward, rather than to this year’s receipts. Three different fiscal anatomies; one shared pacing problem.
For the executives on the other side of this market, the same clock reads differently but no less directly: if your operating model rests on a large offshore-services footprint, your own AI adoption is the demand-side shock in someone else’s balance of payments, and the stability of the places you depend on now turns partly on how fast their institutions can respond to decisions taken in your transformation office.
So the question is not whether AI will reduce service-export employment. It is whether governments will wait for proof before starting a response that takes nearly five years to reach workers, by which point the relevant clock will already have run. The countries that pre-wire their fiscal and workforce responses now will not predict the transition better than anyone else. They will simply be less late.
The velocity ratio is Santiago & Company’s construction from dated public events; no published study quantifies the gap as a ratio. The deployment clock is measured on US data (US Census Bureau Business Trends and Outlook Survey, firm-weighted; the November 2025 series break is disclosed wherever the figure appears); the transmission of that adoption into service-export receipts is argued, not yet measured. Exposure estimates from different institutions use different methodologies and are reported as ranges, not as a consensus. Scenario levels are illustrative bands on stated assumptions, not forecasts. AWSA is a design-stage instrument; its trigger index is pending pilot. US Census Bureau, Business Trends and Outlook Survey (AI-use series, 2022–2025). Philippine K-12 (RA 10533) implementation record; India National Education Policy 2020 implementation reviews; Vietnam Decision 127/QD-TTg (2021) and AI Law (2025); EU AI Act legislative record; Singapore Ministry of Education parliamentary reply, 5 November 2025 (SkillsFuture top-up take-up). Levy Yeyati, “Too Fast to Adjust” (IDB/VoxEU, 2026). IMF Working Paper WP/2025/043 (Philippine BPO macro-criticality, 7.4 percent of GDP, 2023). NASSCOM Strategic Review 2026 (India FY26 revenue ≈ $315B, +6.1 percent; workforce ≈ 5.95M, +135k net). IBPAP via industry press (Philippines 2025: $40B revenue, 1.9M jobs, ≈ +80k). Xpheno (India fresher-intake series). ILO–NASK (2025) and IMF SDN/2024/001 exposure estimates, cited as methodologically distinct. Kenya Hunger Safety Net Programme evaluations; Chile structural balance rule literature; World Bank CAT-DDO records (Colombia); Basel III countercyclical capital buffer documentation. Global Digital Compact, paragraphs 21© and 53; WSIS+20 outcome (A/RES/80/173), paragraph 34 and AI section (paragraphs 84–87). Full evidence register in Santiago & Company’s Evidence Base (claim-tier register published with the Structural Asymmetry report).


Aerospace and defense companies will convert record demand into revenue only by managing qualified throughput. The scarce asset is qualified throughput, and it has to be managed node by node. The approved combination of site, process, workforce, and part at the individual production-node level.
Santiago & Company announced the public release of the AI Workforce Stability Architecture (AWSA) at the United Nations WSIS Forum 2026, introducing an open framework that helps governments monitor, prepare for, and respond to the economic and fiscal impacts of AI-driven labor displacement in service-export economies.
AI is moving on a 15-month clock; governments are moving on a five-year one. For service-export economies, the winners will not be those that forecast labor disruption most precisely, but those that pre-wire fiscal and workforce responses before the evidence becomes undeniable
SpaceX does not need to disrupt the wireless industry to reshape it. By turning satellite coverage into negotiating leverage, it is forcing carriers to rethink who owns the customer relationship when coverage comes from space.